
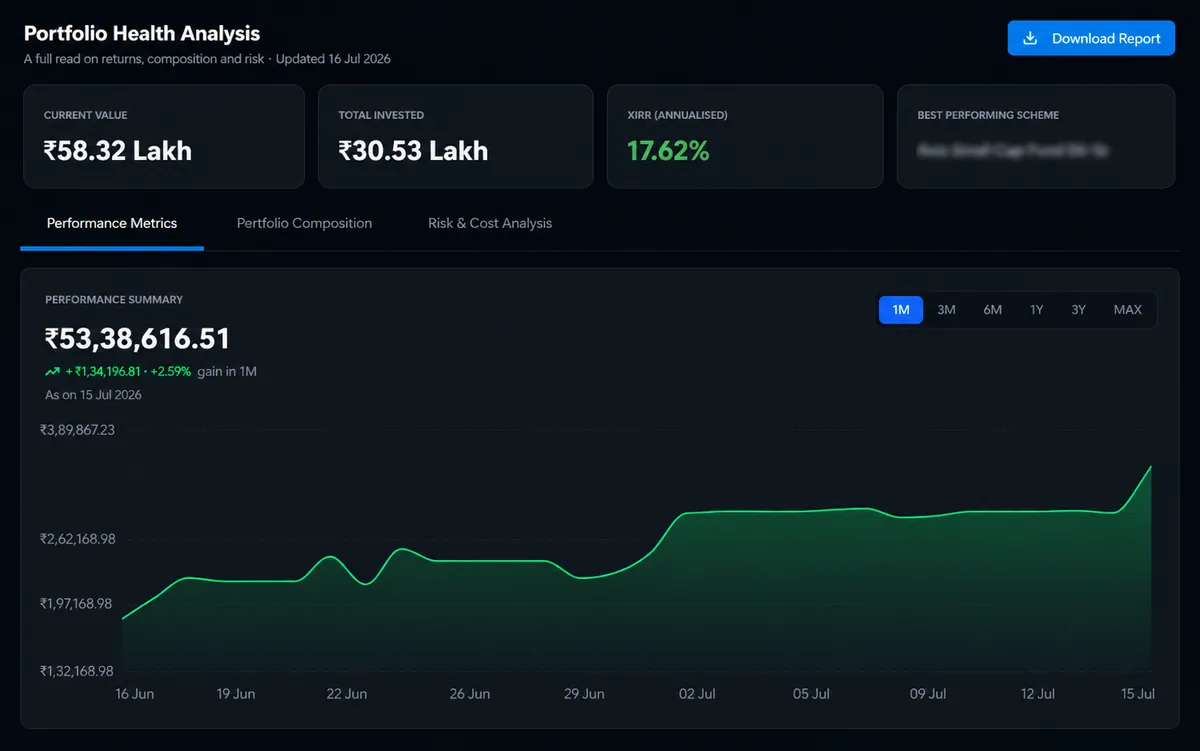
One systematized view per client.
One always-current health view per client — current value, total invested, XIRR and best-performing scheme up top; returns, composition and risk one scroll away.
An hour in Excel becomes a screen.
Portfolio risk, measured.
Portfolio-level volatility, maximum drawdown, Sharpe and beta — the risk actually sitting in the holdings.
This is portfolio risk — distinct from a client’s own tolerance in Risk Profiling. Together they flag portfolios that don’t match capacity.
Weighted category-average ER 1.63% ≈ ₹1,50,242/yr. You’re paying ₹5,938/yr less than the category average – a lean, cost-efficient book.
What the book really costs.
Weighted expense ratio and estimated annual cost across holdings, set against the category average.
It arms the “why not a direct plan” conversation with a number — instead of a shrug.
Catch the overlap you’d miss manually.
Fund correlation and portfolio overlap — average pairwise correlation, most-correlated pairs, shared-holding %, and a “not diversified” flag. Drill to every underlying stock.
How similarly each pair of funds tends to move · based on holdings overlap & sector mix
55 fund pairs analysed · showing the 3 highest
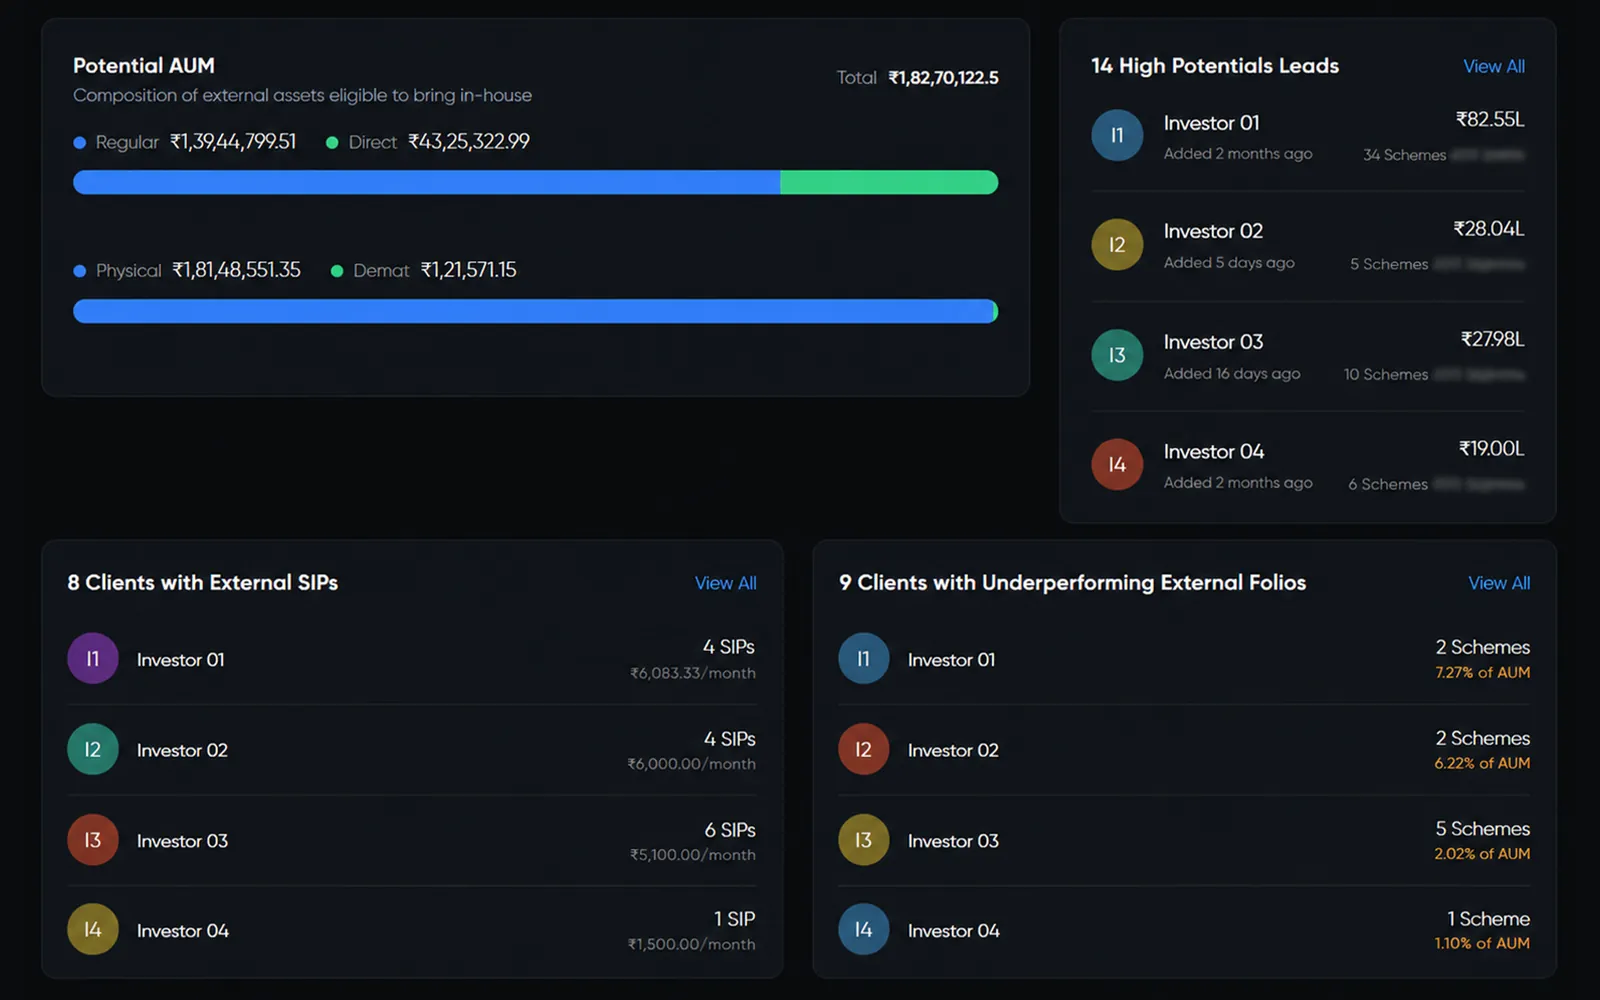
See the money held elsewhere.
Track assets held outside Dhan Saarthi, split by Regular/Direct and Physical/Demat — with ready prospecting lists. It answers the migration objection and hands over AUM to bring in-house.
Connected to the rest of your platform.
Sourced from an onboarded client, analysed here, acted on downstream — outputs flow straight into the recommendation workflow.
Manual review vs. Portfolio Intelligence.
Systematized analysis for your whole book — without the per-client hours.
See it on your own book.
Point Portfolio Intelligence at your clients and see the health, overlap and hidden AUM in minutes.
Frequently asked questions.
The short, honest answers — no sales call required.
What is Portfolio Intelligence in Dhan Saarthi?
The analytical core — systematized health, allocation, risk, expense and overlap analysis for every client, plus Saarthi IQ fund scoring and external AUM tracking. It replaces manual Excel review.
Can it replace my manual Excel portfolio review?
Yes — one always-current health view per client, auto-generated across your whole book.
How does it detect fund overlap?
Through fund correlation and portfolio overlap — pairwise correlation, most-correlated pairs and shared-holding percentage — and it flags concentration.
Is portfolio risk the same as client risk profiling?
No — this measures the portfolio's risk (volatility, drawdown, Sharpe, beta); the client's tolerance lives in Risk Profiling. Used together they flag mismatches.
What is Saarthi IQ?
A 0–100 Compass Score across Management, Alpha Consistency, Risk Efficiency and Participation Efficiency, mapped to five verdicts and refreshed monthly. A research signal, not investment advice.
Does it track assets held outside Dhan Saarthi?
Yes — total and transferable external AUM, active external SIPs, a Potential AUM breakdown and prospecting lists.
What do I do next?
Book a demo or start free.
Pick a slot — see Dhan Saarthi live.
20 minutes, no slides — just the product on your own data.